Windows Task Manager: The Complete Guide

The Windows Task Manager is a powerful tool packed with useful information, from your system7;s overall resource usage to detailed statistics about each process. This guide explains every feature and technical term in the Task Manager.
This article focuses on Windows 107;s Task Manager, although much of this also applies to Windows 7. Microsoft has dramatically improved the Task Manager since the release of Windows 7.
How to Launch the Task Manager

Windows offers many ways to launch the Task Manager. Press Ctrl+Shift+Esc to open the Task Manager with a keyboard shortcut or right-click the Windows taskbar and select ;Task Manager.;
You can also press Ctrl+Alt+Delete and then click ;Task Manager; on the screen that appears or find the Task Manager shortcut in your Start menu.
The Simple View
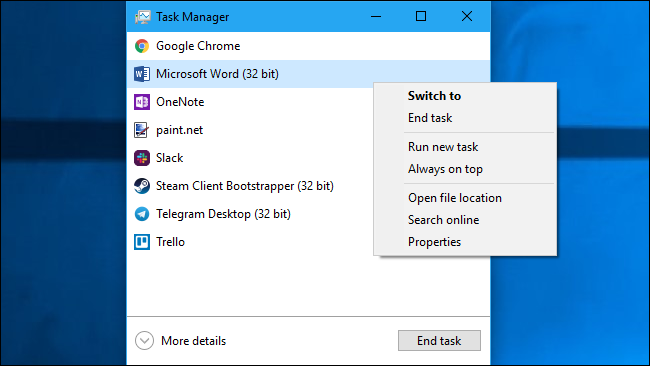
The first time you launch the Task Manager, you7;ll see a small, simple window. This window lists the visible applications running on your desktop, excluding background applications. You can select an application here and click ;End Task; to close it. This is useful if an application isn7;t responding2;in other words, if it7;s frozen2;and you can7;t close it the usual way.
You can also right-click an application in this window to access more options:
- Switch To: Switch to the application7;s window, bringing it to the front of your desktop and putting it in focus. This is useful if you7;re not sure which window is associated with which application.
- End Task: End the process. This works the same as the ;End Task; button.
- Run New Task: Open the Create New Task window, where you can specify a program, folder, document, or website address and Windows will open it.
- Always On Top: Make the Task Manager window itself ;always on top; of other windows on your desktop, letting you see it at all times.
- Open File Location: Open a File Explorer window showing the location of the program7;s .exe file.
- Search Online: Perform a Bing search for the program7;s application name and file name. This will help you see exactly what the program is and what it does.
- Properties: Open the Properties window for the program7;s .exe file. Here you can tweak compatibility options and see the program7;s version number, for example.

While the Task Manager is open, you7;ll see a Task Manager icon in your notification area. This shows you how much CPU (central processing unit) resources are currently in use on your system, and you can mouse over it to see memory, disk, and network usage. It7;s an easy way to keep tabs on your computer7;s CPU usage.
To see the system tray icon without the Task Manager appearing on your taskbar, click Options > Hide When Minimized in the full Task Manager interface and minimize the Task Manager window.
The Task Manager7;s Tabs Explained
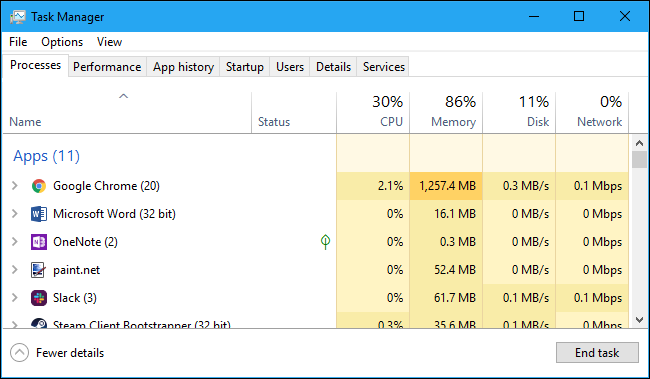
To see the Task Manager7;s more advanced tools, click ;More Details; at the bottom of the simple view window. You7;ll see the full, tabbed interface appear. The Task Manager will remember your preference and will open to the more advanced view in the future. If you want to get back to the simple view, click ;Fewer Details.;
With More Details selected, the Task Manager includes the following tabs:
- Processes: A list of running applications and background processes on your system along with CPU, memory, disk, network, GPU, and other resource usage information.
- Performance: Real-time graphs showing total CPU, memory, disk, network, and GPU resource usage for your system. You7;ll find many other details here, too, from your computer7;s IP address to the model names of your computer7;s CPU and GPU.
- App History: Information about how much CPU and network resources apps have used for your current user account. This only applies to new Universal Windows Platform (UWP) apps2;in other words, Store apps2;and not traditional Windows desktop apps (Win32 applications.)
- Startup: A list of your startup programs, which are the applications Windows automatically starts when you sign into your user account. You can disable startup programs from here, although you can also do that from Settings > Apps > Startup.
- Users: The user accounts currently signed into your PC, how much resources they7;re using, and what applications they7;re running.
- Details: More detailed information about the processes running on your system. This is basically the traditional ;Processes; tab from the Task Manager on Windows 7.
- Services: Management of system services. This is the same information you7;ll find in services.msc, the Services management console.
Managing Processes
The Processes tab shows you a comprehensive list of processes running on your system. If you sort it by name, the list is broken into three categories. The Apps group shows the same list of running applications you7;d see in the ;Fewer details; simplified view. The other two categories are background processes and Windows processes, and they show processes that don7;t appear in the standard simplified Task Manager view.
For example, tools like Dropbox, your antivirus program, background update processes, and hardware utilities with notification area (system tray) icons appear in the background processes list. Windows processes include various processes that are part of the Windows operating system, although some of these appear under ;Background processes; instead for some reason.
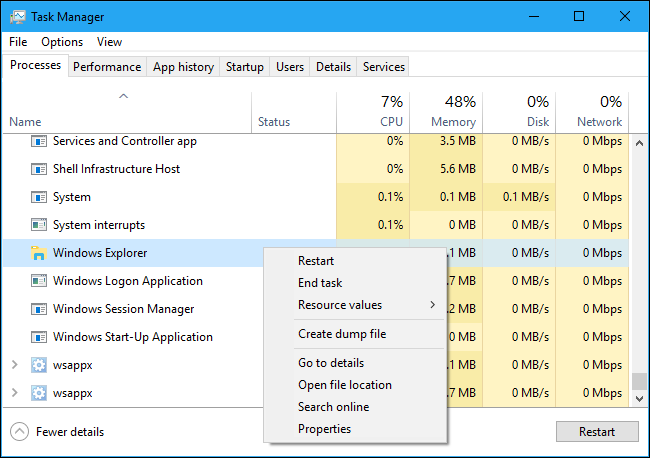
You can right-click a process to see actions you can perform. The options you7;ll see in the context menu are:
- Expand: Some applications, like Google Chrome, have multiple processes are grouped here. Other applications have multiple windows that are part of a single process. You can select expand, double-click the process, or click the arrow to its left to see the entire group of processes individually. This option only appears when you right-click a group.
- Collapse: Collapse an expanded group.
- End task: End the process. You can also click the ;End Task; button below the list.
- Restart: This option only appears when you right-click Windows Explorer. It lets you restart explorer.exe instead of simply ending the task. In older versions of Windows, you had to end the Explorer.exe task and then launch it manually to fix problems with the Windows desktop, taskbar, or Start menu. Now, you can just use this Restart option.
- Resource values: Lets you choose whether you want to see the percentage or precise values for memory, disk, and network. In other words, you can choose whether you want to see the precise amount of memory in MB or the percentage of your system7;s memory applications are using.
- Create dump file: This is a debugging tool for programmers. It captures a snapshot of the program7;s memory and saves it to disk.
- Go to details: Go to the process on the Details tab so you can see more detailed technical information.
- Open file location: Open File Explorer with the process7;s .exe file selected.
- Search online: Search for the name of the process on Bing.
- Properties: View the Properties window of the .exe file associated with the process.
You should not end tasks unless you know what the task does. Many of these tasks are background processes important to Windows itself. They often have confusing names, and you may need to perform a web search to find out what they do. We have a whole series explaining what various processes do, from conhost.exe to wsappx.
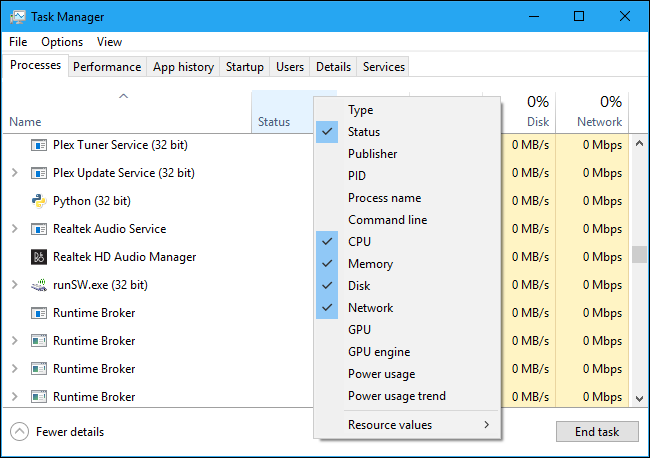
This tab also shows you detailed information about each process and their combined resource usage. You can right-click the headings at the top of the list and choose the columns you want to see. The values in each column are color-coded, and a darker orange (or red) color indicates greater resource usage.
You can click a column to sort by it2;for example, click the CPU column to see running processes sorted by CPU usage with the biggest CPU hogs at the top. The top of the column also shows the total resource usage of all the processes on your system. Drag and drop columns to reorder them. The available columns are:
- Type: The category of the process, which is App, Background process, or Windows process.
- Status: If a program appears to be frozen, ;Not Responding; will appear here. Programs sometimes begin responding after a bit of time and sometimes stay frozen. If Windows has suspended a program to save power, a green leaf will appear in this column. Modern UWP apps can suspend to save power, and Windows can also suspend traditional desktop apps.
- Publisher: The name of the program7;s publisher. For example, Chrome displays ;Google Inc.; and Microsoft Word displays ;Microsoft Corporation.;
- PID: The process identifier number Windows has associated with the process. The process ID may be used by certain functions or system utilities. Windows assigns a unique process ID each time it starts a program, and the process ID is a way of distinguishing between several running processes if multiple instances of the same program are running.
- Process Name: The file name of the process. For example, File Explorer is explorer.exe, Microsoft Word is WINWORD.EXE, and the Task Manager itself is Taskmgr.exe.
- Command Line: The full command line used to launch the process. This shows you the full path to the process7;s .exe file (for example, ;C:\WINDOWS\Explorer.EXE;) as well as any command-line options used to launch the program.
- CPU: The CPU usage of the process, displayed as a percentage of your total available CPU resources.
- Memory: The amount of your system7;s physical working memory the process is currently using, displayed in MB or GB.
- Disk: The disk activity a process is generating, displayed as MB/s. If a process isn7;t reading from or writing to disk at the moment, it will display 0 MB/s.
- Network: The network usage of a process on the current primary network, displayed in Mbps.
- GPU: The GPU (graphics processing unit) resources used by a process, displayed as a percentage of the GPU7;s available resources.
- GPU Engine: The GPU device and engine used by a process. If you have multiple GPUs in your system, this will show you which GPU a process is using. See the Performance tab to see which number (;GPU 0; or ;GPU 1; is associated with which physical GPU.
- Power Usage: The estimated power usage of a process, taking into account its current CPU, disk, and GPU activity. For example, it might say ;Very low; if a process isn7;t using many resources or ;Very high; if a process is using a lot of resources. If it7;s high, that means it7;s using more electricity and shortening your battery life if you have a laptop.
- Power Usage Trend: The estimated impact on power usage over time. The Power Usage column just shows the current power usage, but this column tracks power usage over time. For example, if a program occasionally uses a lot of power but isn7;t using much right now, it may say ;Very low; in the power usage column and ;High; or ;Moderate; in the Power Usage Trend column.
When you right-click the headings, you7;ll also see a ;Resource Values; menu. This is the same option that appears when you right-click an individual process. Whether or not you access this option through right-clicking an individual process, it will always change how all processes in the list appear.
Task Manager Menu Options
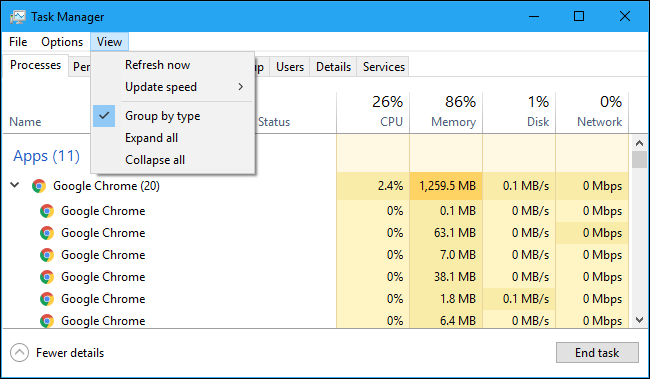
There are also a few useful options in the Task Manager7;s menu bar:
- File > Run New Task: Launch a program, folder, document, or network resource by providing its address. You can also check ;Create this task with administrative privileges; to launch the program as Administrator.
- Options > Always on Top: The Task Manager window will always be on top of other windows while this option is enabled.
- Options > Minimize on Use: The Task Manager will be minimized whenever you right-click a process and select ;Switch To.; Despite the odd name, that7;s all this option does.
- Options > Hide When Minimized: The Task Manager will stay running in the notification area (system tray) when you click the minimize button if you enable this option.
- View > Refresh Now: Immediately refresh the data displayed in the Task Manager.
- View > Update Speed: Choose how frequently the data displayed in the Task Manager is updated: High, Medium, Low, or Paused. With Paused selected, the data isn7;t updated until you select a higher frequency or click ;Refresh Now.;
- View > Group By Type: With this option enabled, processes on the Processes tab are grouped into three categories: Apps, Background Processes, and Windows Processes. With this option disabled, they7;re shown mixed in the list.
- View > Expand All: Expand all the process groups in the list. For example, Google Chrome uses multiple processes, and they7;re shown combined into a ;Google Chrome; group. You can expand individual process groups by clicking the arrow to the left of their name, too.
- View > Collapse All: Collapse all the process groups in the list. For example, all Google Chrome processes will just be shown under the Google Chrome category.
Viewing Performance Information
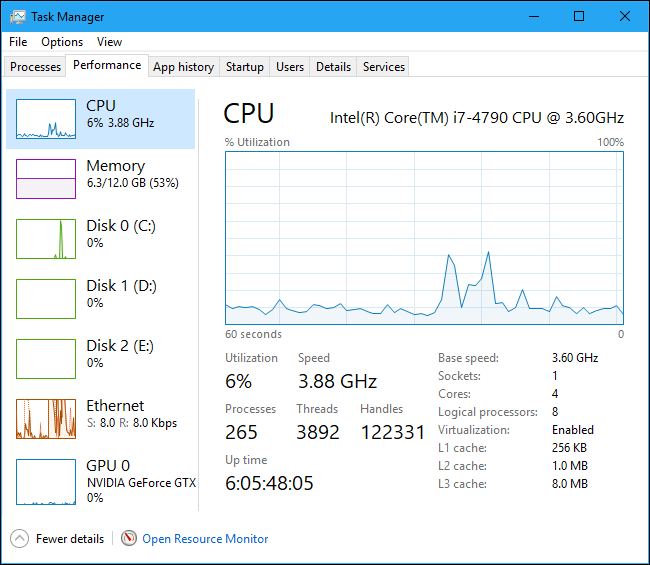
The Performance tab shows real-time graphs displaying the usage of system resources like CPU, memory, disk, network, and GPU. If you have multiple disks, network devices, or GPUs, you can see them all separately.
You7;ll see small graphs in the left pane, and you can click an option to see a larger graph in the right pane. The graph shows resource usage over the last 60 seconds.
In addition to resource information, the Performance page shows information about your system7;s hardware. Here are just some things the different panes show in addition to resource usage:
- CPU: The name and model number of your CPU, its speed, the number of cores it has, and whether hardware virtualization features are enabled and available. It also shows your system7;s ;uptime,; which is how long your system has been running since it last booted up.
- Memory: How much RAM you have, its speed, and how many of the RAM slots on your motherboard are used. You can also see how much of your memory is currently filled with cached data. Windows calls this ;standby.; This data will be ready and waiting if your system needs it, but Windows will automatically dump the cached data and free up space if it needs more memory for another task.
- Disk: The name and model number of your disk drive, its size, and its current read and write speeds.
- Wi-Fi or Ethernet: Windows shows a network adapter7;s name and its IP addresses (both IPv4 and IPv6 addresses) here. For Wi-Fi connections, you can also see the Wi-Fi standard in use on the current connection2;for example, 802.11ac.
- GPU: The GPU pane shows separate graphs for different types of activity2;for example, 3D vs. video encoding or decoding. The GPU has its own built-in memory, so it also shows GPU memory usage. You can also see the name and model number of your GPU here and the graphics driver version it7;s using. You can monitor GPU usage right from the Task Manager without any third-party software.
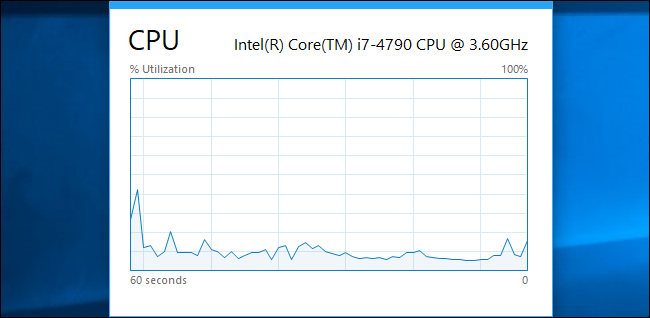
You can also turn this into a smaller window if you7;d like to see it on screen at all times. Just double-click anywhere in the empty white space in the right pane, and you7;ll get a floating, always-on-top window with that graph. You can also right-click the graph and select ;Graph Summary View; to enable this mode.
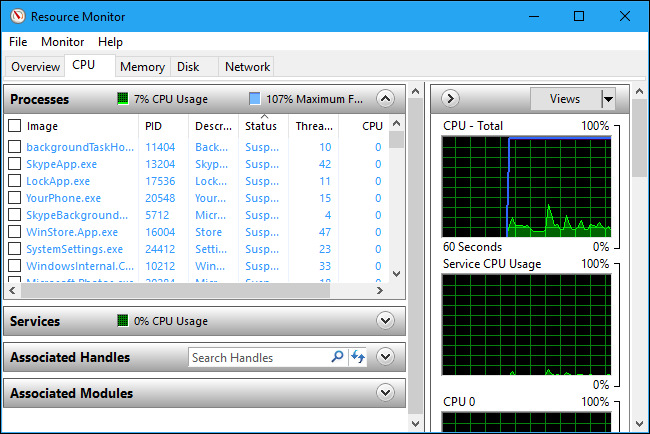
The ;Open Resource Monitor; button at the bottom of the window opens the Resource Monitor tool, which provides more detailed information about GPU, memory, disk, and network usage by individual running processes.
Consulting App History
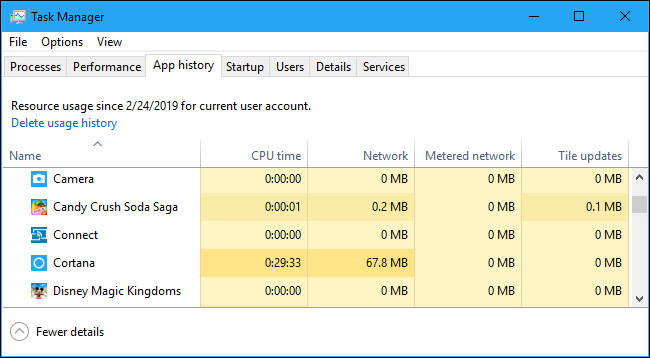
The App History tab only applies to Universal Windows Platform (UWP) apps. It doesn7;t show information about traditional Windows desktop apps, so most people won7;t find it too useful.
At the top of the window, you7;ll see the date Windows started collecting resource usage data. The list shows UWP applications and the amount of CPU time and network activity the application has generated since that date. You can right-click the headings here to enable a few more options for more insight about network activity:
- CPU Time: The amount of CPU time the program has used within this time frame.
- Network: The total amount of data transferred over the network by the program within this time frame.
- Metered Network: The amount of data transferred over metered networks. You can set a network as metered to save data on it. This option is intended for networks you have limited data on, like a mobile network to which you7;re tethering.
- Tile Updates: The amount of data the program has downloaded to display updated live tiles on Windows 107;s Start menu.
- Non-metered Network: The amount of data transferred over non-metered networks.
- Downloads: The amount of data downloaded by the program on all networks.
- Uploads: The amount of data uploaded by the program on all networks.
Controlling Startup Applications
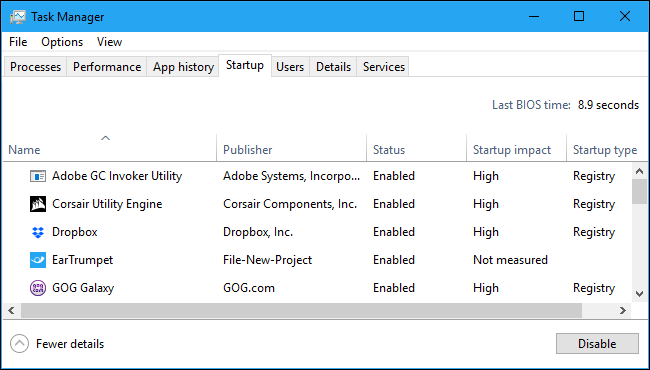
The Startup tab is Windows 107;s built-in startup programs manager. It lists all the applications that Windows automatically starts for your current user account. For example, programs in your Startup folder and programs set to start in the Windows registry both appear here.
To disable a startup program, right-click it and select ;Disable; or select it and click the ;Disable; button. To re-enable it, click the ;Enable; option that appears here instead. You can also use the Settings > Apps > Startup interface to manage startup programs.
At the top right corner of the window, you will see a ;Last BIOS time; on some systems. This shows how long your BIOS (or UEFI firmware) took to initialize your hardware when you last booted your PC. This will not appear on all systems. You won7;t see it if your PC7;s BIOS doesn7;t report this time to Windows.
As usual, you can right-click the headings and enable additional columns. The columns are:
- Name: The name of the program.
- Publisher: The name of the program7;s publisher.
- Status: ;Enabled; appears here if the program automatically starts when you sign in. ;Disabled; appears here if you7;ve disabled the startup task.
- Startup Impact: An estimate of how much CPU and disk resources the program uses when it starts. Windows measures and tracks this in the background. A lightweight program will show ;Low,; and a heavy program will show ;High.; Disabled programs show ;None.; You can speed up your boot process more by disabling programs with a ;High; startup impact than by disabling ones with a ;Low; impact.
- Startup Type: This shows whether the program is starting because of a registry entry (;Registry;) or because it7;s in your startup folder (;Folder.;)
- Disk I/O at Startup: The disk activity the program performs at startup, in MB. Windows measures and records this each boot.
- CPU at Startup: The amount of CPU time a program uses at startup, in ms. Windows measures and records this at boot.
- Running Now: The word ;Running; appears here if a startup program is currently running. If this column appears entry for a program, the program has shut itself down, or you7;ve closed it yourself.
- Disabled Time: For startup programs you7;ve disabled, the date and time you disabled a program appears here
- Command Line: This shows the full command line the startup program launches with, including any command line options.
Checking on Users
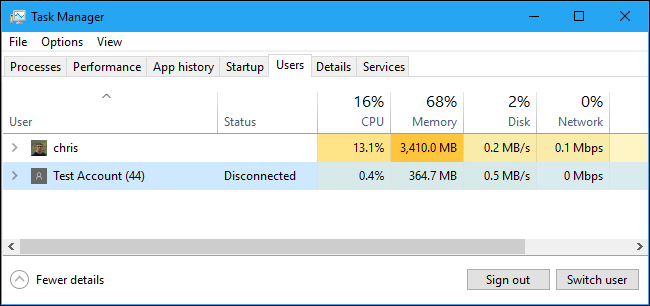
The Users tab displays a list of signed in users and their running processes. If you7;re the only person signed into your Windows PC, you7;ll see only your user account here. If other people have signed in and then locked their sessions without signing out, you7;ll also see those2;locked sessions appear as ;Disconnected.; This also shows you the CPU, memory, disk, network, and other system resources used by processes running under each Windows user account.
You can disconnect a user account by right-clicking it and selecting ;Disconnect; or force it to sign off by right-clicking it and selecting ;Sign Off.; The Disconnect option terminates the desktop connection, but the programs continue to run, and the user can sign back in2;like locking a desktop session. The Sign Off option terminates all processes2;like signing out of Windows.
You can also manage another user account7;s processes from here if you7;d like to end a task that belongs to another running user account.
If you right-click the headings, the available columns are:
- ID: Each signed in user account has its own session ID number. Session ;0; is reserved for system services, while other applications may create their own user accounts. You usually won7;t need to know this number, so it7;s hidden by default.
- Session: The type of session this is. For example, it will say ;Console; if it7;s being accessed on your local system. This is primarily useful for server systems running remote desktops.
- Client Name: The name of the remote client system accessing the session, if it7;s being accessed remotely.
- Status: The status of the session2;for example, if a user7;s session is locked, the Status will say ;Disconnected.;
- CPU: Total CPU used by the user7;s processes.
- Memory: Total memory used by the user7;s processes.
- Disk: Total disk activity associated with the user7;s processes.
- Network: Total network activity from the user7;s processes.
Managing Detailed Processes
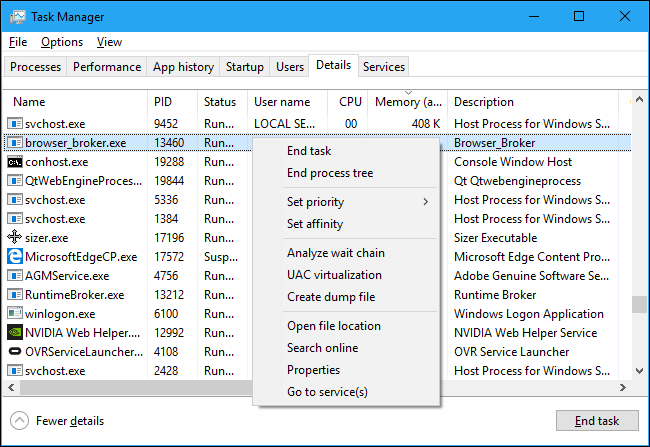
This is the most detailed Task Manager pane. It7;s like the Processes tab, but it provides more information and shows processes from all user accounts on your system. If you7;ve used the Windows 7 Task Manager, this will look familiar to you; it7;s the same information the Processes tab in Windows 7 displays.
You can right-click processes here to access additional options:
- End task: End the process. This is the same option found on the normal Processes tab.
- End process tree: End the process, and all the processes created by the process.
- Set priority: Set a priority for the process: Low, Below normal, Normal, Above normal, High, and Realtime. Processes start at normal priority. Lower priority is ideal for background processes, and higher priority is ideal for desktop processes. However, Microsoft recommends against messing with Realtime priority.
- Set affinity: Set the processor affinity of a process2;in other words, on which processer a process runs. By default, processes run on all processors in your system. You can use this to limit a process to a particular processor. For example, this is sometimes helpful for old games and other programs that assume you only have a single CPU. Even if you have a single CPU in your computer, each core appears as a separate processor.
- Analyze wait chain: View what threads in the processes are waiting for. This shows you which processes and threads are waiting to use a resource used by another process, and is a useful debugging tool for programmers to diagnose hangs.
- UAC virtualization: Enable or disable User Account Control virtualization for a process. This feature fixes applications that require administrator access by virtualizing their access to system files, redirecting their file and registry access to other folders. It7;s primarily used by older programs2;for example, Windows XP-era programs2;that weren7;t written for modern versions of Windows. This is a debugging option for developers, and you shouldn7;t need to change it.
- Create dump file: Capture a snapshot of the program7;s memory and save it to disk. This is a useful debugging tool for programmers.
- Open file location: Open a File Explorer window showing the process7;s executable file.
- Search online: Perform a Bing search for the name of the process.
- Properties: View the properties window of the process7;s .exe file.
- Go to service(s): Show the services associated with the process on the Services tab. This is particularly useful for svchost.exe processes. The services will be highlighted.
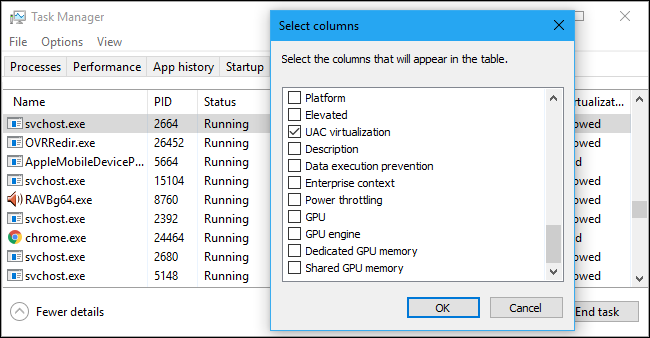
If you right-click the headings and select ;Show Columns,; you7;ll see a much longer list of information you can show here, including many options that aren7;t available on the Processes tab.
Here7;s what every possible column means:
- Package Name: For Universal Windows Platform (UWP) apps, this displays the name of the app package the process is from. For other apps, this column is empty. UWP apps are generally distributed via the Microsoft Store.
- PID: The unique process ID number associated with that process. This is associated with the process and not the program2;for example, if you close and reopen a program, the new program process will have a new process ID number.
- Status: This shows whether the process is running or suspended to save power. Windows 10 always ;suspends; UWP apps you aren7;t using to save system resources. You can also control whether Windows 10 suspends traditional desktop processes.
- User name: The name of the user account running the process. You will often see system user account names here, like SYSTEM and LOCAL SERVICE.
- Session ID: The unique number associated with the user session running the process. This is the same number shown for a user on the Users tab.
- Job object ID: The ;job object in which the process is running.; Job objects are a way to group processes so they can be managed as a group.
- CPU: The percentage of CPU resources the process is currently using across all CPUs. If nothing else is using CPU time, Windows will show the System Idle Process using it here. In other words, if the System Idle Process is using 90{c15a66f4e73aee90bd9f5f7bdf76277ceb686efcc6613faa92af9bd435960bdb} of your CPU resources, that means other processes on your system are using a combined 10{c15a66f4e73aee90bd9f5f7bdf76277ceb686efcc6613faa92af9bd435960bdb}, and it was idle 90{c15a66f4e73aee90bd9f5f7bdf76277ceb686efcc6613faa92af9bd435960bdb} of the time.
- CPU time: The total processor time (in seconds) used by a process since it began running. If a process closes and restarts, this will be reset. It7;s a good way to spot CPU-hungry processes that may be idling at the moment.
- Cycle: The percentage of the CPU cycles the process is currently using across all CPUs. It7;s unclear exactly how this is different from the CPU column, as Microsoft7;s documentation doesn7;t explain this. However, the numbers in this column are generally pretty similar to the CPU column, so it7;s likely a similar piece of information measured differently.
- Working set (memory): The amount of physical memory the process is currently using.
- Peak working set (memory): The maximum amount of physical memory the process has used.
- Working set delta (memory): The change in working set memory from the last refresh of the data here.
- Memory (active private working set): The amount of physical memory used by the process that can7;t be used by other processes. Processes frequently cache some data to make better use of your RAM, but can quickly give up that memory space if another process needs it. This column excludes data from suspended UWP processes.
- Memory (private working set): The amount of physical memory used by the process that can7;t be used by other processes. This column does not exclude data from suspended UWP processes.
- Memory (shared working set): The amount of physical memory used by the process that can be used by other processes when necessary.
- Commit size: The amount of virtual memory Windows is reserving for the process.
- Paged pool: The amount of pageable kernel memory the Windows kernel or drivers are allocating for this process. The operating system can move this data to the paging file when necessary.
- NP pool: The amount of non-pageable kernel memory the Windows kernel or drivers are allocating for this process. The operating system can7;t move this data to the paging file.
- Page faults: The number of page faults generated by the process since it began running. These occur when a program tries to access memory it doesn7;t currently have allocated to it, and are normal.
- PF Delta: The change in the number of page faults since the last refresh.
- Base priority: The priority of the process2;for example, this might be Low, Normal, or High. Windows prioritizes scheduling processes with higher priorities. System background tasks that aren7;t urgent may have low priority compared to desktop program processes, for example.
- Handles: The current number of handles in the process7;s object table. Handles represent system resources like files, registry keys, and threads.
- Threads: The number of active threads in a process. Each process runs one or more threads, and Windows allocates processor time to them. Threads in a process share memory.
- User objects: The number of ;window manager objects; used by the process. This includes windows, menus, and cursors.
- GDI objects: The number of Graphics Device Interface objects used by the process. These are used for drawing the user interface.
- I/O reads: The number of read operations performed by the process since it started. I/O stands for Input/Output. This includes file, network, and device input/output.
- I/O writes: The number of write operations performed by the process since it started.
- I/O other: The number of non-read and non-write operations performed by the process since it started. For example, this includes control functions.
- I/O read bytes: The total number of bytes read by the process since it started.
- I/O write bytes: The total number of bytes written by the process since it started.
- I/O other bytes: The total number of bytes used in non-read and non-write I/O operations since the process started.
- Image path name: The full path to the process7;s executable file.
- Command line: The exact command line the process was launched with, including the executable file and any command-line arguments.
- Operating system context: The minimum operating system the program is compatible with if any information is included in the application7;s manifest file. For example, some applications might say ;Windows Vista,; some ;Windows 7,; and others ;Windows 8.1;. Most won7;t display anything in this column at all.
- Platform: Whether this is a 32-bit or 64-bit process.
- Elevated: Whether the process is running in elevated mode2;in other words, with Administrator2;permissions or not. You will see either ;No; or ;Yes; for each process.
- UAC virtualization: Whether User Account Control virtualization is enabled for the process. This virtualizes the program7;s access to the registry and file system, letting programs designed for older versions of Windows run without Administrator access. Options include Enabled, Disabled, and Not Allowed2;for processes that require system access.
- Description: A human-readable description of the process from its .exe file. For example, chrome.exe has the description ;Google Chrome,; and explorer.exe has the description ;Windows Explorer.; This is the same name displayed on the Name column in the normal Processes tab.
- Data execution prevention: Whether Data Execution Prevention (DEP) is enabled or not for the process. This is a security feature that helps protect applications from attacks.
- Enterprise context: On domains, this shows what enterprise context an app is running in. It could be in an enterprise domain context with access to enterprise resources, a ;Personal; context without access to work resources, or ;Exempt; for Windows system processes.
- Power throttling: Whether power throttling is enabled or disabled for a process. Windows automatically throttles certain applications when you7;re not using them to save battery power. You can control which applications are throttled from the Settings app.
- GPU: The percentage of GPU resources used by the process2;or, more specifically, the highest utilization across all GPU engines.
- GPU engine: The GPU engine the process is using2;or, more specifically, the GPU engine the process is using the most. See the GPU information on the Performance tab for a list of GPUs and their engines. For example, even if you only have one GPU, it likely has different engines for 3D rendering, encoding video, and decoding video.
- Dedicated GPU memory: The total amount of GPU memory the process is using across all GPUs. GPUs have their own dedicated video memory that7;s built-in on discrete GPUs and a reserved portion of normal system memory on onboard GPUs.
- Shared GPU memory: The total amount of system memory shared with the GPU the process is using. This refers to data stored in your system7;s normal RAM that7;s shared with the GPU, not data stored in your GPU7;s dedicated, built-in memory.
Working With Services
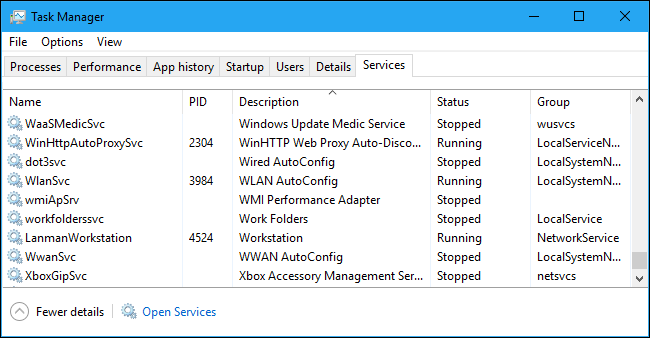
The Services tab shows a list of the system services on your Windows system. These are background tasks that Windows runs, even when no user account is signed in. They7;re controlled by the Windows operating system. Depending on the service, it may be automatically started at boot or only when necessary.
Many services are part of Windows 10 itself. For example, the Windows Update services downloads updates and the Windows Audio service is responsible for sound. Other services are installed by third-party programs. For example, NVIDIA installs several services as part of its graphics drivers.
You shouldn7;t mess with these services unless you know what you7;re doing. But, if you right-click them, you7;ll see options to Start, Stop, or Restart the service. You can also select Search Online to perform a Bing search for information about the service online or ;Go to Details; to show the process associated with a running service on the Details tab. Many services will have a ;svchost.exe; process associated with them.
The Service pane7;s columns are:
- Name: A short name associated with the service
- PID: The process identifier number of the process associated with the service.
- Description: A longer name that provides more information about what the service does.
- Status: Whether the service is ;Stopped; or ;Running.;
- Group: The group the service is in, if applicable. Windows loads one service group at a time at startup. A service group is a collection of similar services that are loaded as a group.
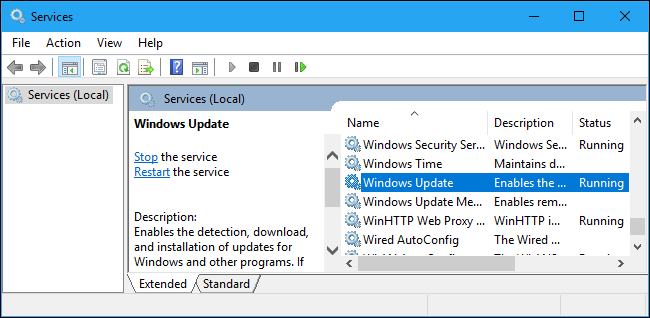
For more information about these services, click the ;Open Services; link at the bottom of the window. This Task Manager pane is just a less powerful services administration tool, anyway.
Process Explorer: A More Powerful Task Manager
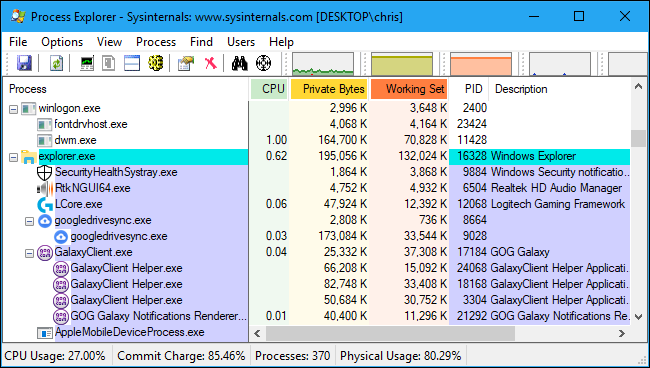
If the built-in Windows Task Manager isn7;t powerful enough for you, we recommend Process Explorer. This is a free program from Microsoft; it7;s part of the SysInternals suite of useful system tools.
Process Explorer is packed with features and information not included in the Task Manager. You can view which program has a particular file open and unlock the file, for example. The default view also makes it easy to see which processes have opened which other processes. Check out our in-depth, multi-part guide to using Process Explorer to learn more.
